Comparing Squiggle Models
May 8, 2019, 10:23 p.m.
Tags:
Quick post, thought I'd dig into the Squiggle API and see how each model has performed relative to their own predictions.
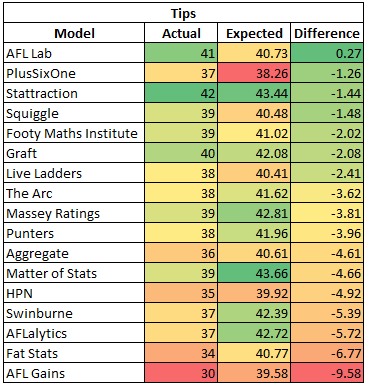
What this means is that, hypothetically, say a model tipped the home team to win in every game with a probability of 60%. After 7 rounds (63 matches), assuming they're well calibrated, they would expect to get about 0.6*63 ~ 38 matches correct.
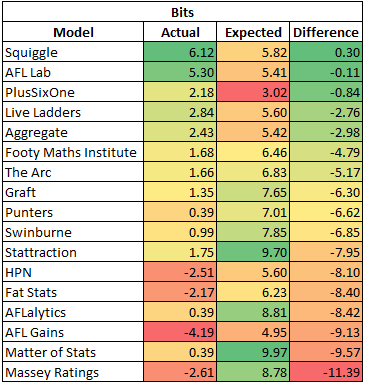
Similarly, they would expect to gain a certain number of bits when correct and lose a certain number of bits when they're wrong. So their expected bits per match can be calculated too.
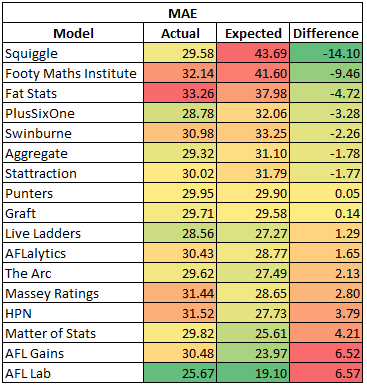
Expected MAE can also be calculated by bringing in the margin prediction. If we assume the margin is distributed normally, we can fit a normal distribution to a models margin prediction, then calculate the expected deviation from the mean.
This is all very hand wavy at the moment but here's the results:
We can see AFL Lab is right on par with expected tips. Everyone else is doing worse than expected to varying degrees:
For bits, AFL Lab is right on par too. Squiggle is ahead of expectation and everyone else in true 2019 style is on negative bits and playing catchup:
For MAE which I am finding fascinating, AFL Lab is actually doing the worst compared to how their model expects to perform, however they have the best MAE of all models. Less one sided than tips and bits, there's a pretty even split between models outperforming and underperforming against their own expectations here: