A New Way to Think About AFL Scoring
Jan. 27, 2020, 3:06 p.m.
Since launching my first model a few years ago I've been toying with the idea of coming up with a new model that doesn't just predict results, but can be used to explain more of the story around a teams' performance on top of "Team X had more shots or generated higher quality shots".
To begin with I wanted to break down the winning margin into contributions representing the ability to generate more scoring shots, as well as the ability to generate higher quality scoring shots or convert scoring shots at a higher rate. After generating an algorithm for this simple case I can then extend it to a more complex model. Wait around for that!
So first we can represent the score for each team as a multiplication of shots and conversion (points per shot):
\[ \text{Score} = \text{Shots} \times \text{Points per Shot} \]
Normally when calculating contributions, we have additive formulas. For example if a company has multiple revenue streams, stream A earning $1m in 2018 then $1.1m in 2019 and stream B earning $2m in 2018 and $2.1m in 2019 then the contribution of each stream to the total increase in revenue is easily calculated as $0.1m/$0.2m = 50% for both streams. This is because the revenue can be represented as:
\[ \text{Revenue} = \text{Revenue}_A + \text{Revenue}_B \]
However for our multiplicative formula the same logic wont work. To get around this, we take the log of the score to turn it into an additive equation:
\[ \ln ( \text{Score} ) = \ln (\text{Shots} \times \text{Points per Shot} ) = \ln (\text{Shots} ) + \ln ( \text{Points per Shot} ) \]
Then we calculate the difference in the log of the shots and log of points per shot to calculate the contribution of each measure to the margin between the teams. For example, take the 2018 grand final between West Coast and Collingwood. The final score was WCE 11.13.79 def COL 11.8.74. Clearly WCE generated more shots but were more innaccurate. How do each of these contribute to the margin of 5 points? The table below shows the preliminary calculations:
| WCE | COL | Diff | |
|---|---|---|---|
| Score | 79 | 74 | +5 |
| \( \ln (\text{Score} ) \) | 4.37 | 4.3 | +0.07 |
| Shots | 24 | 19 | +5 |
| \( \ln (\text{Shots} ) \) | 3.18 | 2.94 | +0.26 |
| Points per Shot | 3.29 | 3.89 | -0.6 |
| \( \ln (\text{Points per Shot} ) \) | 1.19 | 1.36 | -0.17 |
So we have a difference of +0.07 to WCE in the log scores, a difference of +0.26 to WCE in the log shots and a difference of -0.17 to WCE (or + 0.17 to COL) in the log points per shot.
As contributions to the difference in the log scores, we get a contribution of +357% (0.26/0.07) due to the shot difference and -257% (-0.17/0.07) due to the points per shot difference. These might seem weird but when you multiply them back into the actual margin they make more sense. Notice also that they add up to 100%.
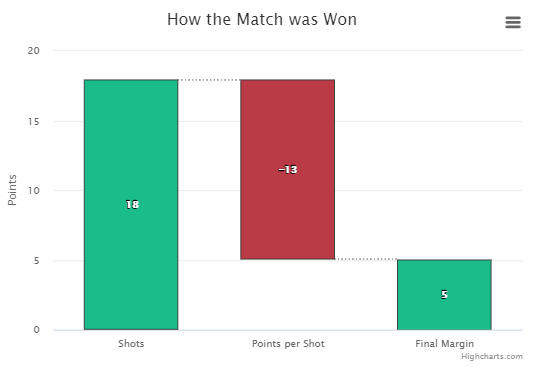
Multiplying the contributions with the margin of 5 points, relative to WCE, they benefited by approx 18 points due to differences in scoring shots, but suffered approx 13 points due to the difference in shot conversion. This sums to the +5 point margin.
These numbers kind of make sense. WCE had 5 more shots, which at an average conversion of 50% or 3.5 points per shot equates to about an 18 point advantage. The shot conversion contribution is hard to rationalise, but given the shot contribution + conversion contribution add to the match margin I'm comfortable with it.
We can represent this in a waterfall chart like this, showing how West Coast benefited from their scoring shot dominance but suffered due to their inaccuracy.
This kind of analysis is great as it gives us a guide to what teams rely on to win matches. Using a model consisting of simply scoring shots and conversion doesn't give us too much, but this analysis can be generalised to more complicated models where the score can be represented by this kind of chain of multiplication.
For example I've generalised this analysis to represent scores using the following equation:
\[ \text{Score} = ( \text{Clearances} + \text{Intercepts} + \text{Kick Ins} ) \times \text{Inside 50s per Chain} \times \text{Shots per Inside 50} \times \text{Points per Shot} \]
The first term represents a teams' ability to get the ball from kick ins, clearances of intercepts. The second represents how efficient they are at getting the ball inside 50 once they have it. The third represents how well they convert inside 50s to scoring shots and the last represents the teams ability to generate high quality shots/convert shots into goals rather than behinds.
This gives us a much richer picture of how a match played out. For example we can make a similar waterfall chart as above but this time consider the more complex model of scoring:
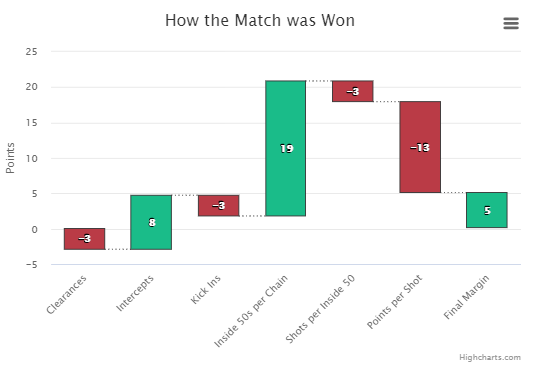
This waterfall chart shows how the possession game was about even, West Coasts' intercept game broke even with the Pies' clearance game + the fact that West Coast were inaccurate and gave the ball back through kick ins more often than Collingwood.
However West Coast generated a lot more inside 50s per chain compared to Collingwood, and even though Collingwood were more efficient at generating shots and converting shots to goals once inside 50, the inside 50 imbalance was ultimately what pushed the match in West Coasts' favour and by a small margin at that.
I think being able to look at all matches like this would add great value to the AFL community so I'm going to make these waterfall charts available on my website soon, along with a bunch of other changes.
I've also taken this scoring model and created an ELO model that estimates teams' abilities in each of the terms in the equation above. As the stats to do this are only available back to 2012 this model has less history but I think it adds a lot of value in telling a story of how a match was won. This will allow me to create a waterfall chart for how my model thinks the match will play out and compare to how it actually played out.
In the meantime I'm getting the models ready for 2020. Hoping to launch an AFLW page soon too. Running these for season 2020 is also dependent on the AFL adding stats back to their website which hopefully is sooner rather than later...
Powered by Froala Editor